Table of Contents
Introduction
Debugging is a great skill to learn how to solve every problem with your JavaScript code.
Every day we wake up, have a nice breakfast, head to the computer and there we sit, to write perfect code that does exactly what we want.
Then we wake up.
That would be ideal, right? But it was a dream.
As good as you can become, there’s no way you can write bug-free code. Code has bugs. By definition. A bug is a problem that you did not see or anticipate when you set out to write the code.
So, what will you do when your application encounters a bug, which could be an error that causes our code to stop working, or it could be an error that causes our program to function incorrectly? Of course, it is not easy to detect the latter type of bug.
How can we quickly identify and fix it as quickly as possible if our project has an extremely large code base?
What we need is an effective debugging method.
Factors that make debugging ineffective
When debugging JavaScript incorrectly, there are several underlying issues that you should be aware of:
Insufficient logging information: When relying solely on console.log(), the logged information may not be sufficient to understand the problem. This can lead to misunderstandings and waste time during the debugging process.
Dependency on console.log(): Restricting yourself from using console.log() as a debugging tool can make the debugging process slow and inefficient. You should consider other debugging tools to leverage powerful features such as breakpoints, watches, and expressions.
Lack of understanding of flow code: An important aspect of effective debugging is understanding the nature of flow code. If you don’t have a clear understanding of the code’s execution flow, fixing one error may introduce more severe bugs in the program.
How do you deal with bugs?
The nature of debugging:
- Identifying the source of the error (Narrowing down the location of the error occurrence, especially in projects with a large codebase).
- Understanding why the error occurs (Investigating the deep-rooted nature of the error-causing factors).
To address the above two points, it is essential to have a clear understanding of the code’s flow and the interrelated features to avoid introducing additional errors. Moreover, to make the error-fixing process more effective, having a proper debugging methodology is essential. Below are some tools that can help simplify the debugging process.
Tips and Tricks for debugging JavaScript faster
Debugger
The debugger statement invokes any available debugging functionality, such as setting a breakpoint. If no debugging functionality is available, this statement has no effect – source
Breakpoints
As an alternative to the debugger statement, you can also add breakpoints in Chrome DevTools manually, by using the built-in breakpoint functionality. You have access to the following types of breakpoints:
- line-of-code breakpoints
- conditional line-of-code breakpoints
- logpoints
- DOM breakpoints
- XHR breakpoints
- event listener breakpoints
- breakpoints set at caught and uncaught exceptions
- function breakpoints
You can refer to the complete documentation on the breakpoint here.
Display objects as a table
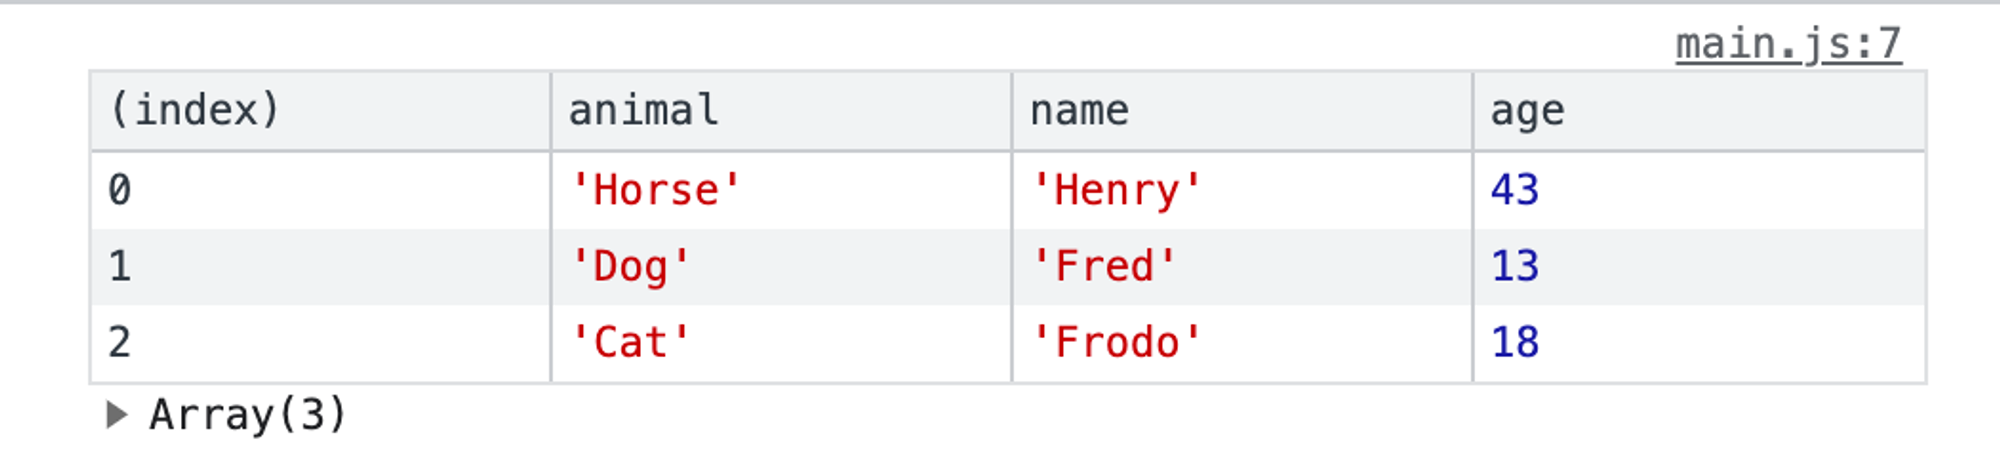
Sometimes, you have a complex set of objects that you want to view. You can either console.log them and scroll through the list, or break out the console.table helper. It makes it easier to see what you’re dealing with!
const animals = [
    { animal: 'Horse', name: 'Henry', age: 43 },
    { animal: 'Dog', name: 'Fred', age: 13 },
    { animal: 'Cat', name: 'Frodo', age: 18 }
];

console.table(animals);
Will output:
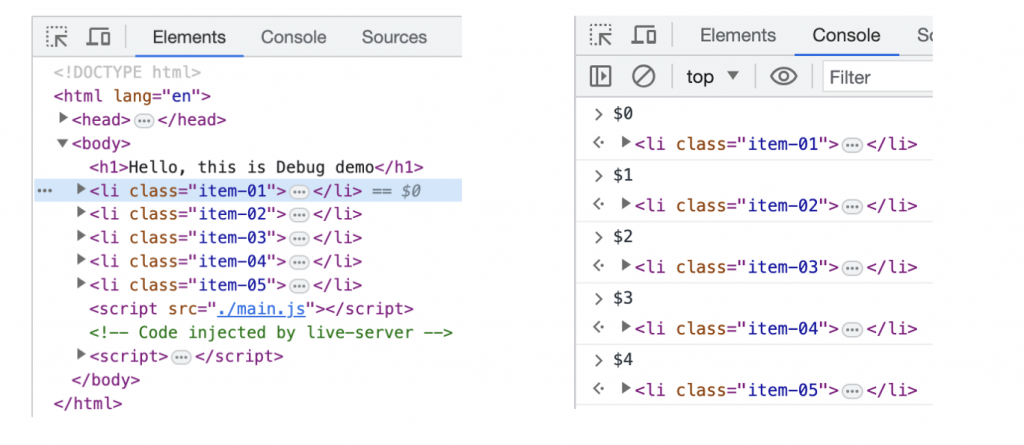
How to find your DOM elements quickly
Mark a DOM element in the elements panel and use it in your console. Chrome Inspector keeps the last five elements in its history so that the final marked element displays with $0, the second to last marked element $1 and so on. If you mark the following items in order ‘item-4′, ‘item-3’, ‘item-2’, ‘item-1’, ‘item-0’ then you can access the DOM nodes like this in the console:
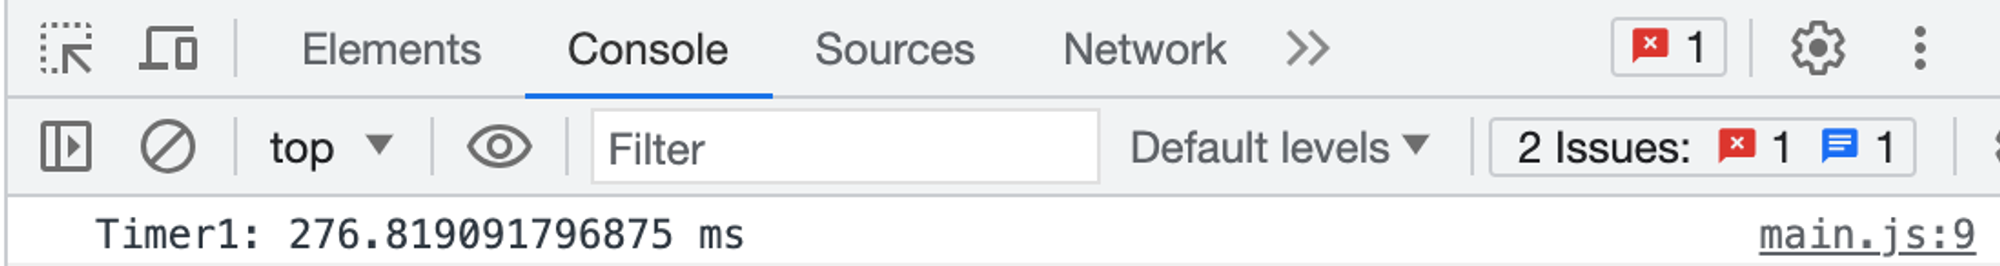
Benchmark loops using console.time() and console.timeEnd()
It can be super useful to know exactly how long something has taken to execute, especially when debugging slow loops. You can even set up multiple timers by assigning a label to the method. Let’s see how it works:
console.time('Timer1');
let items = [];
for(let i = 0; i < 100000; i++){
   items.push({index: i});
}
console.timeEnd('Timer1');
Will output:
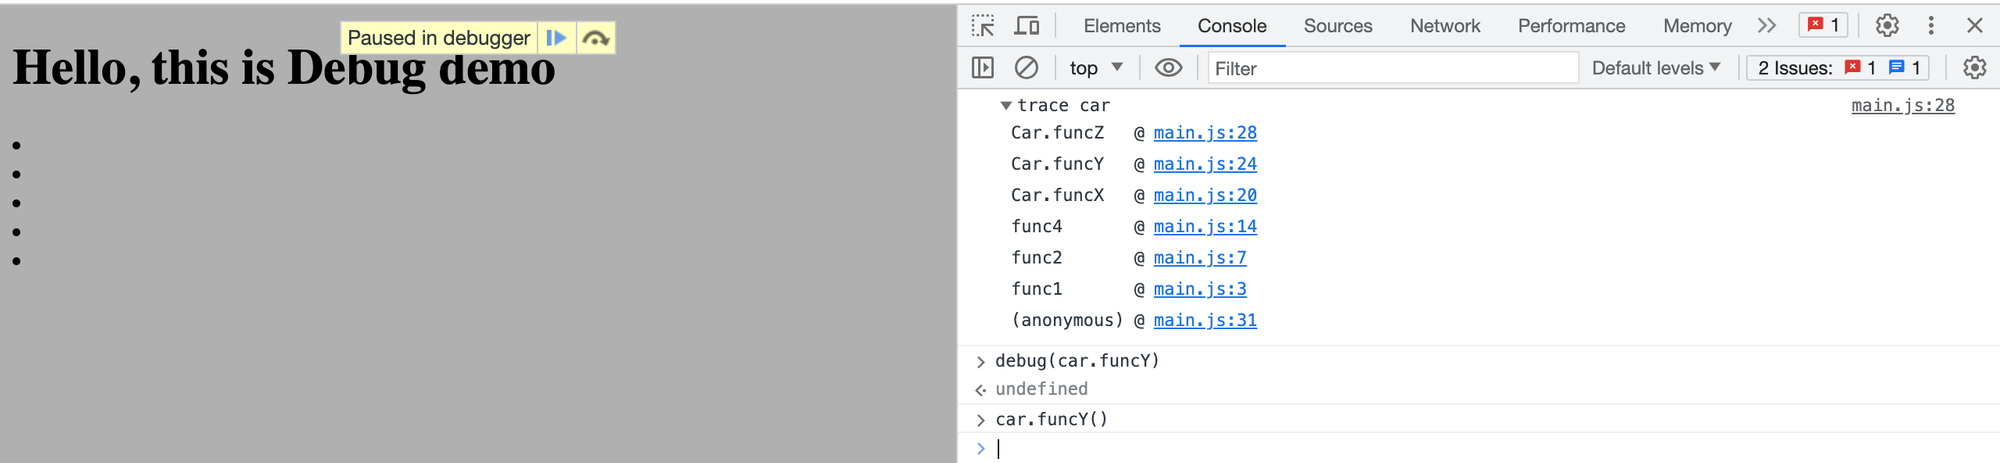
Get the stack trace for a function
You will have a lot of views and be triggering a lot of events, so eventually you will come across a situation where you want to know what caused a particular function call. Since JavaScript is not a very structured language, it can sometimes be hard to get an overview of what happened and when. This is when console.trace (or just trace in the console) comes in handy to be able to debug JavaScript. Imagine you want to see the entire stack trace for the function call funcZ in the car instance:
let car;
let func1 = function() {
	func2();
}

let func2 = function() {
	func4();
}
let func3 = function() {
}

let func4 = function() {
	car = new Car();
	car.funcX();
}
let Car = function() {
	this.brand = 'volvo';
	this.color = 'red';
	this.funcX = function() {
		this.funcY();
	}

	this.funcY = function() {
		this.funcZ();
	}

	this.funcZ = function() {
		console.trace('trace car')
	}
}
func1();
Will output:
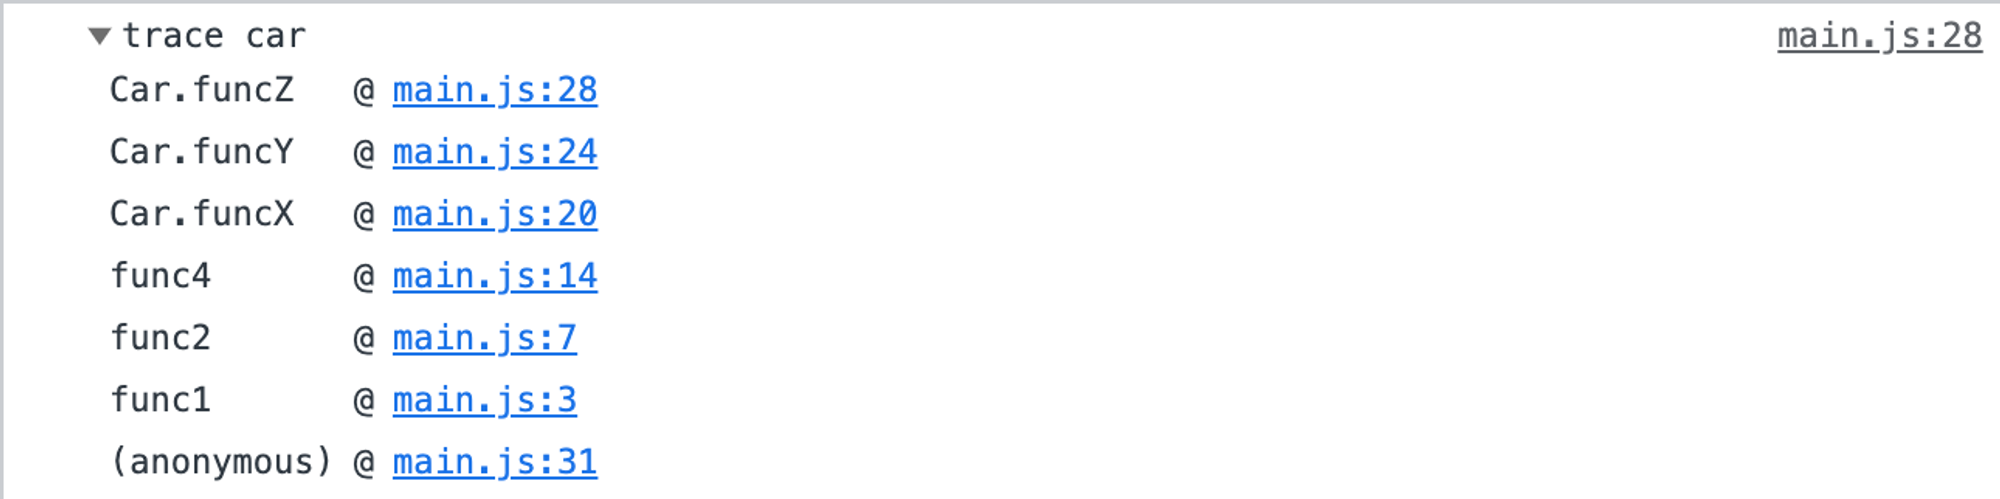
Now we can see that func1 called func2, which called func4. Func4 then ****created an instance of Car and then called the function car.funcX, and so on. Even though you think you know your script well this can still be quite handy. Let’s say you want to improve your code. Get the trace and your great list of all related functions. Every single one is clickable, and you can now go back and forth between them. It’s like a menu just for you.
Quickly find a function to debug
Let’s say you want to set a breakpoint in a function.The two most common ways to do that are:
- Find the line in your inspector and add a breakpoint
- Add a debugger in your script
In both of these solutions, you have to navigate manually around in your files to isolate the particular line you want to debug. What’s probably less common is to use the console. Use debug(funcName) in the console and the script will stop when it reaches the function you passed in. It’s quick, but the downside is that it doesn’t work on private or anonymous functions. Otherwise, it’s probably the fastest way to find a function to debug. (Note: there’s a function called console.debug which is not the same thing, despite the similar naming.)
Type debug(car.funcY) in the console and the script will stop in debug mode when it gets a function call to car.funcY
Find the important things in complex debugging
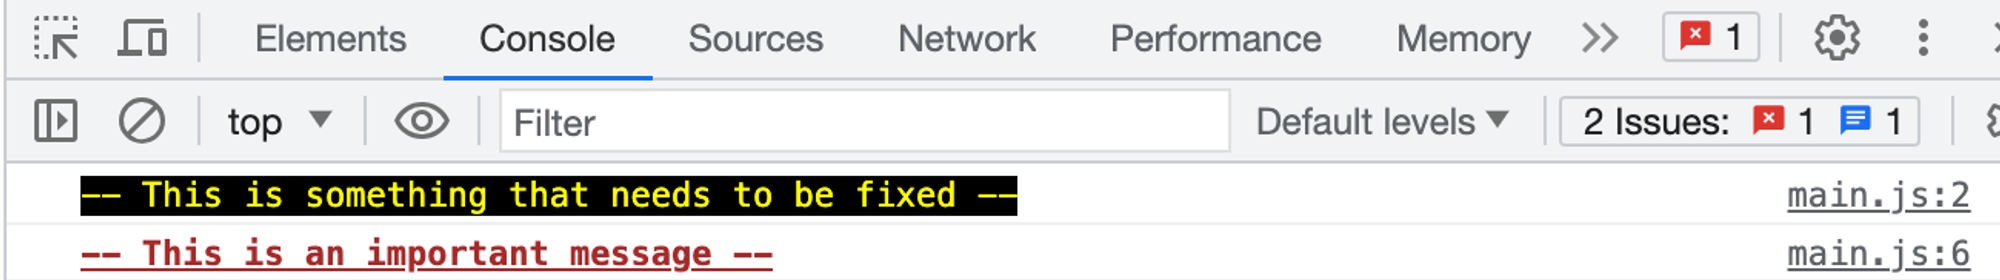
In more complex debugging we sometimes want to output many lines. One thing you can do to keep a better structure of your outputs is to use more console functions, for example, console.log, console.debug, console.warn, console.info, console.error and so on. You can then filter them in your inspector. Sometimes this is not really what you want when you need to debug JavaScript. You can get creative and style your messages, if you so choose. Use CSS and make your own structured console messages when you want to debug JavaScript:
console.todo = function(msg) {
    console.log('%c%s %s %s', 'color: yellow; background-color: black;', '--', msg, '--');
}

console.important = function(msg) {
    console.log('%c%s %s %s', 'color: brown; font-weight: bold; text-decoration: underline;',
'--', msg, '--');
}
console.todo("This is something that needs to be fixed");
console.important('This is an important message');
Will output:
Watch specific function calls and arguments
In the Chrome console, you can keep an eye on specific functions. Every time the function is called, it will be logged with the values that it was passed in.
let demo = function(x, y, z) {
    console.log(x, y, z)
};

const button = document.querySelector('.button')
button.addEventListener('click', () => demo(1,2,3))
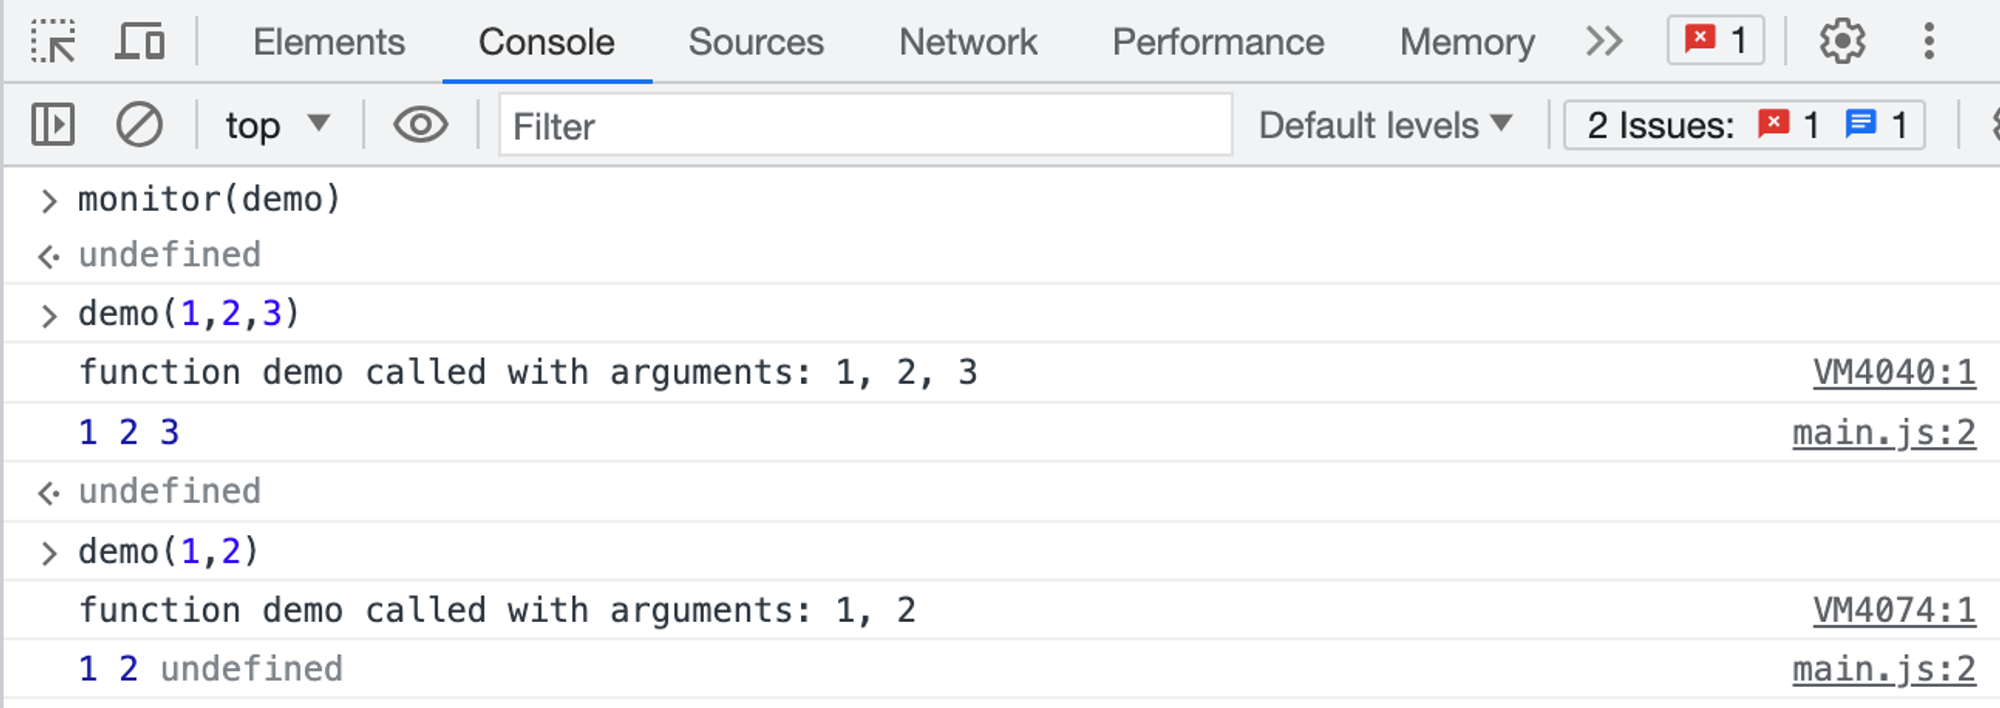
This is a great way to see which arguments are passed into a function. Ideally, the console could tell how many arguments to expect, but it cannot. In the above example, demo function expects three arguments, but only two are passed in. If that’s not handled in the code it could lead to a possible bug.
This is a great way to see which arguments are passed into a function. Ideally, the console could tell how many arguments to expect, but it cannot. In the above example, demo function expects three arguments, but only two are passed in. If that’s not handled in the code it could lead to a possible bug.
Quickly access elements in the console
A faster way to do a querySelector in the console is with the dollar sign. $(‘css-selector’) will return the first match of CSS selector. $$(‘css-selector’) will return all of them. If you are using an element more than once, it’s worth saving it as a variable.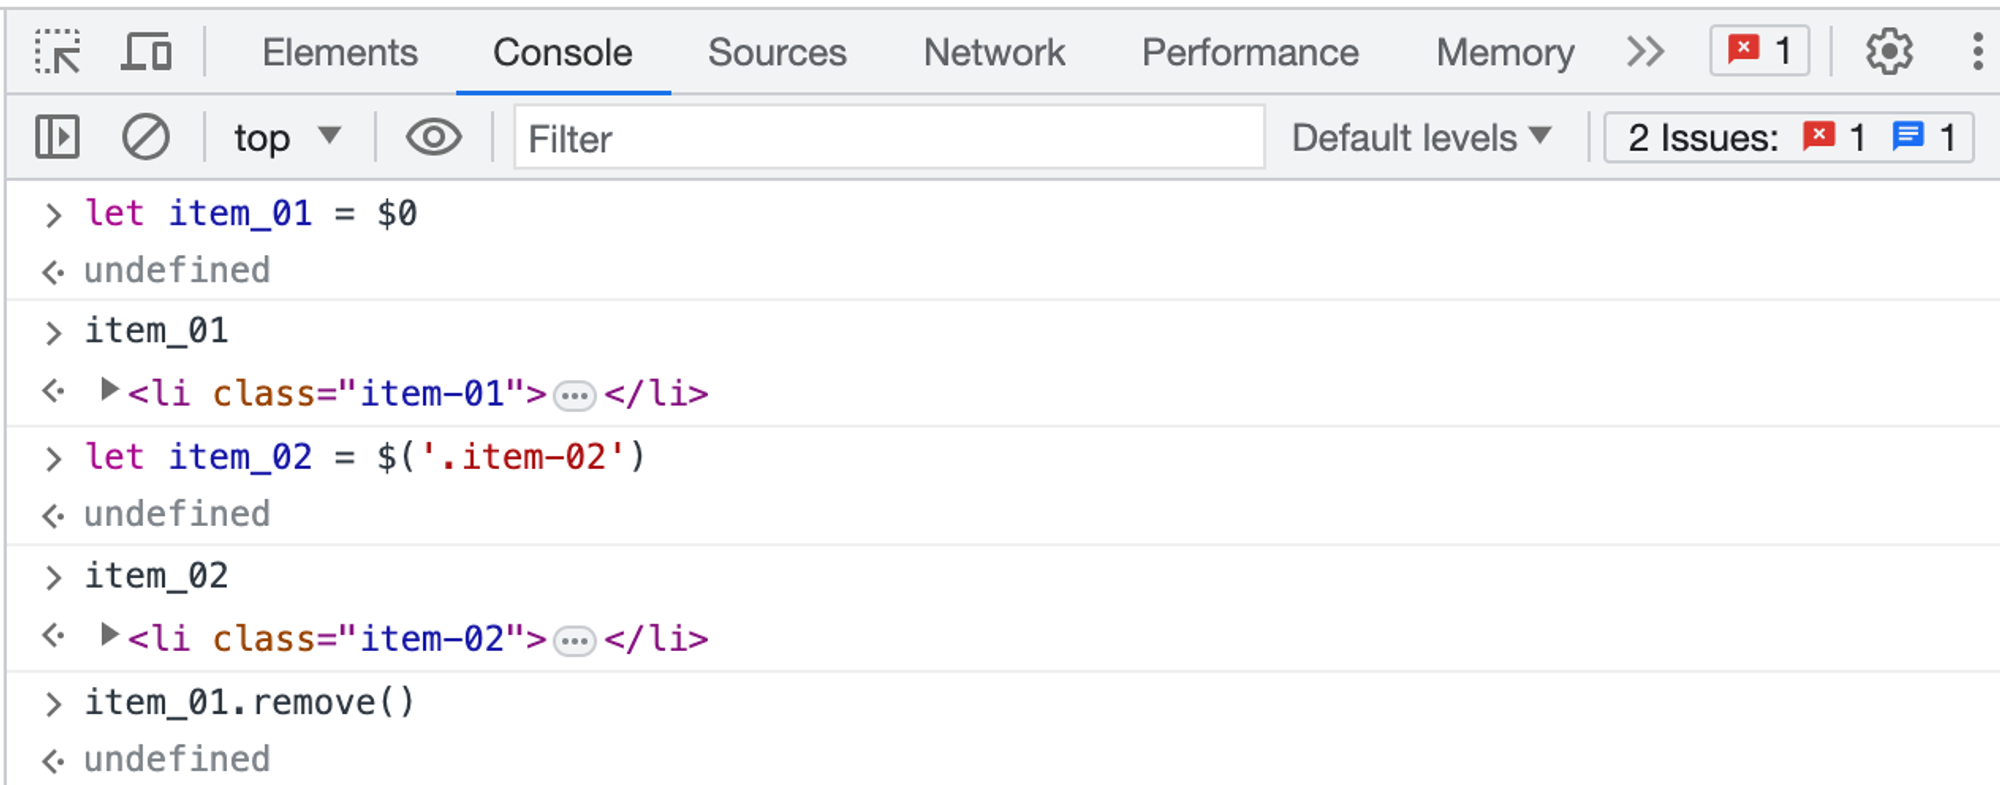
Break on node change
The DOM can be a funny thing. Sometimes things change and you don’t know why. However, when you need to debug JavaScript, Chrome lets you pause when a DOM element changes. You can even monitor its attributes. In Chrome Inspector, right-click on the element and pick a break on the setting to use: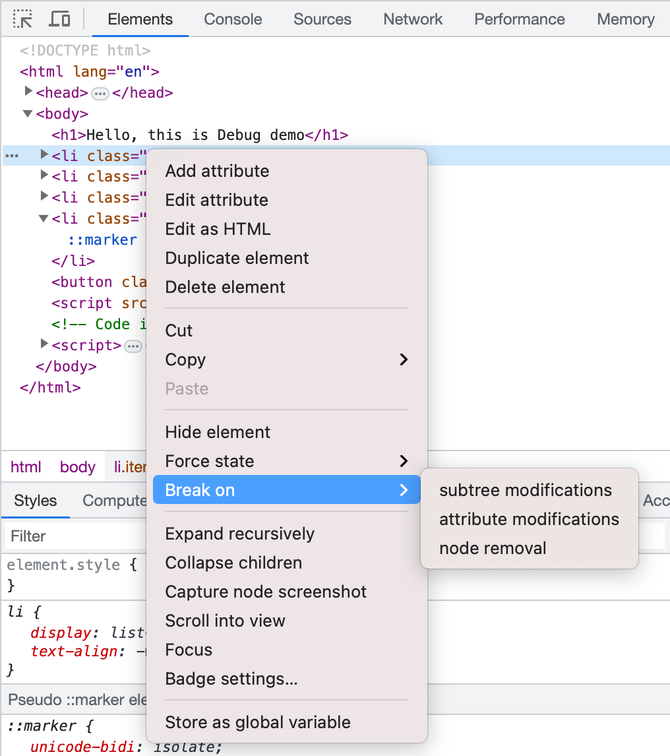
Conclusion
Debugging JavaScript can be a challenging task, but by using the right tools and techniques, you can make the process more efficient and effective. The most important aspect is to understand the code flow of the project to avoid introducing additional errors.
TuanDV